Process Discovery
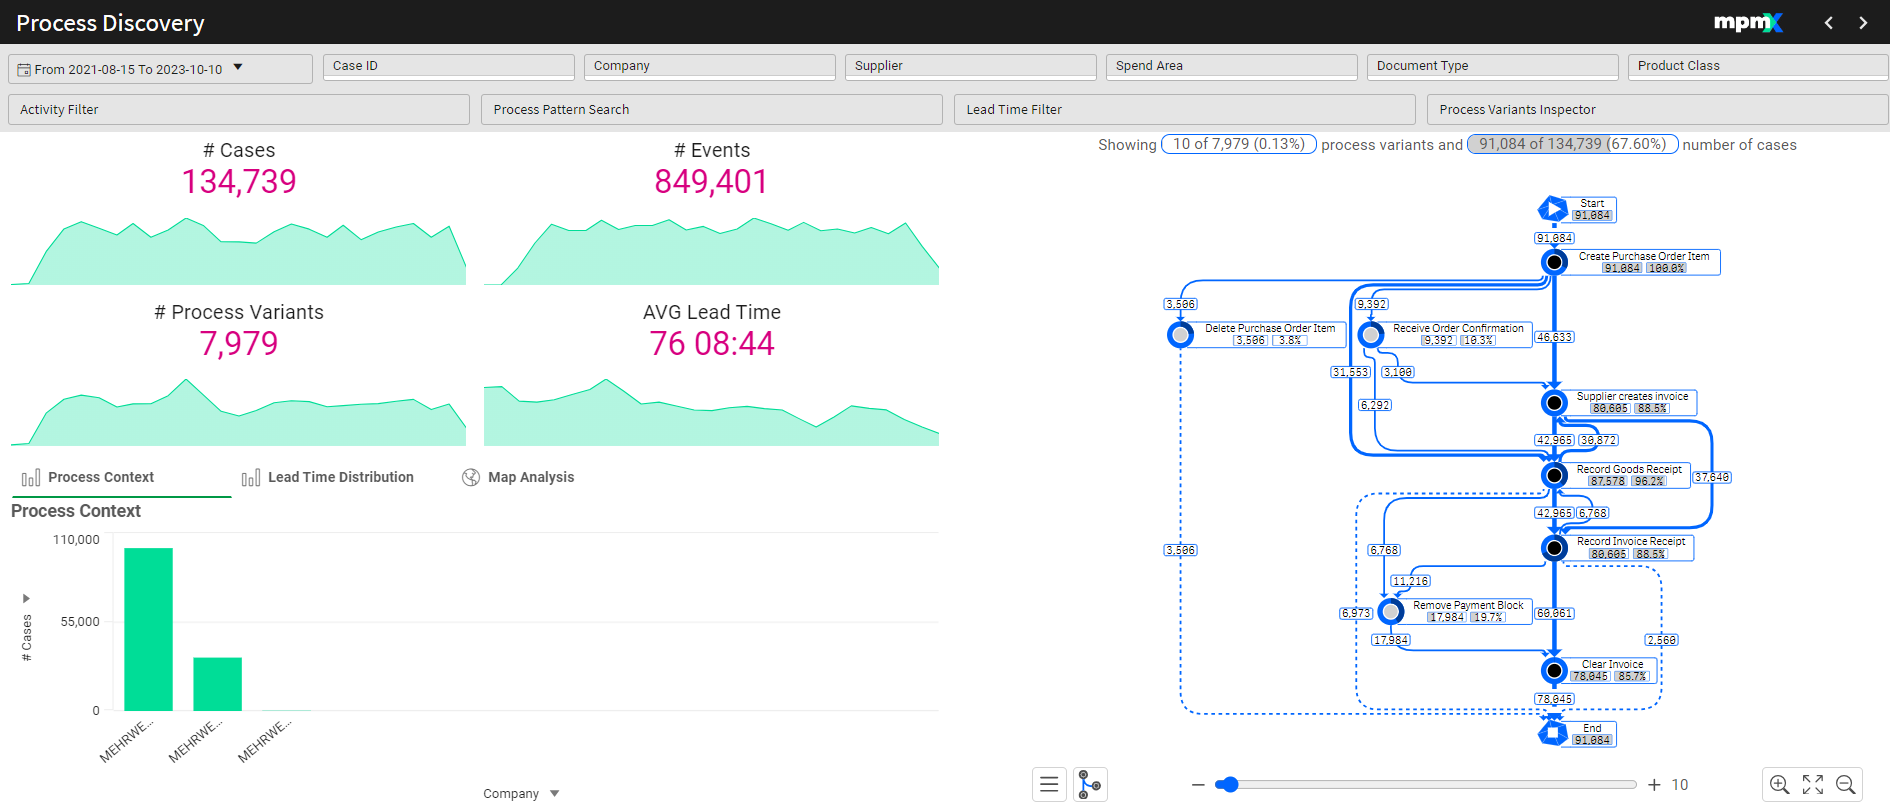
The Process Discovery Worksheet offers a do-it-yourself approach to process analysis, providing a clear overview of basic Process Performance Indicators (PPIs) and visualizing process flows. Core functions include the ability to analyze processes using key metrics, view an overview of cases and activities, and break down PPIs by different contexts using pivoting in the Additional Analysis. Users can also visualize the overall process flow and access the event log for deeper insights into case events, helping identify patterns, inefficiencies, and areas for improvement.
Type: Toolsheet
Key Figures
# Cases
- Displays the total number of individual cases that have passed through or are currently in the process.
- A timeline below the figure shows the change in this number over time, allowing you to track trends.
# Events
- Displays the total number of events that have occurred within the process.
# Process Variants
- Shows how many different ways a case has progressed through the process.
- Variants can include:
- New steps
- Skipped steps
- Changes in the order of steps
- Loops or repeated steps (e.g., goods receipt occurring twice for separate deliveries)
- Changed or reworked steps
AVG Lead Time
- Displays the average or median time it takes for a case to complete the entire process.
- This helps assess the cycle time and identify any delays or inefficiencies.
Process Analyzer
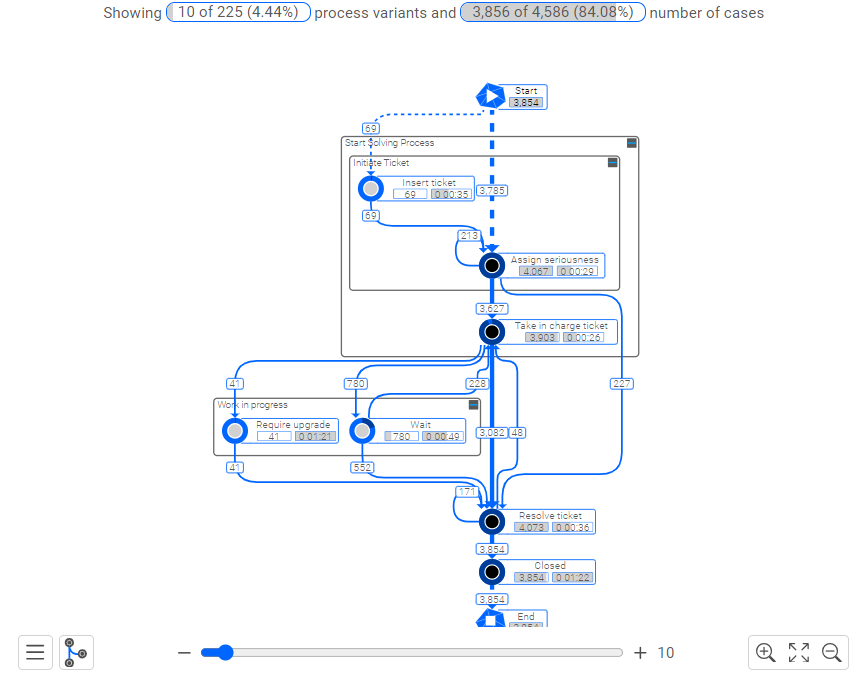
Above the process analyzer you will see the key figures for the number and percent of variants show in the selection compared to the total as well as the number and percent of cases.
Select a specific activity or edge to filter on and dig deeper.
Click here for more information on the Process Analyzer.
Process Context and Lead Time Distribution and Map Analysis
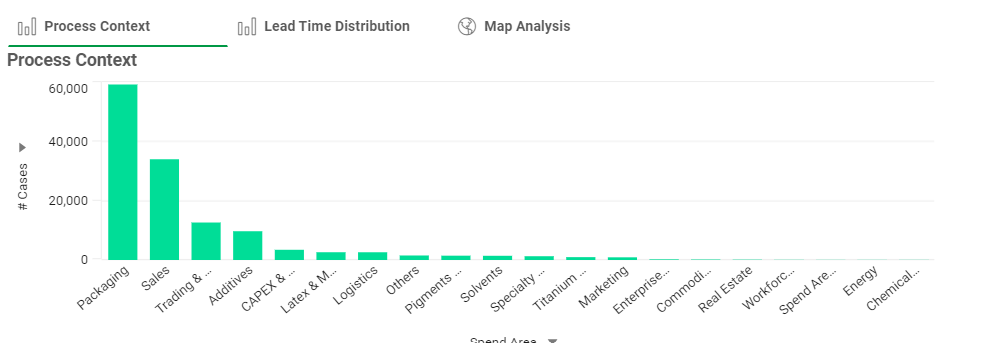
See context information plotted against various metrics. Select one or more bars to filter further.
The Process Context | Chart
Use the X- and Y-axis dropdowns to change the dimensions and measures shown, e.g. the number of cases for each supplier or the number of variants for each product class.
The Lead Time Distribution | Chart
Switch tabs to see the Lead Time Distribution. This distribution shows how many cases are included in each lead time class. By default, the lead time classes have a size that adapts to the lead times supplied, e.g. five days (15-20d, etc.)
The Map Analysis | Map
Switch to the third tab to see a world map to search by country, region or city. Alternatively a production map of a factory showing how goods being produced are routed through the production floor is also a possibility.